


Finding the annual return on investment (ROI) for assets at OP bank

I am a customer of the Finnish OP bank. Like many other people, I had more leftover money than normally during the coronavirus pandemic. And like many others, I also invested some of that money into the stock market. I do not follow the stock market, but at the end of the year, I want to know how my investments performed: I want to know the annual return on investment (ROI) or the IRR (internal rate of return) for my whole portfolio and also for my individual stocks.
Annual return on investment (ROI)
You would think that your bank should make it easy for you to follow your portfolio's performance. At least for my bank (OP), this is not the case. Finding the annual ROI (or the IRR) for an investment portfolio at OP bank's online banking service is NOT easy. For individual stocks, it even requires you to do your own calculations in Google Sheets, LibreOffice Calc, or Excel (or whatever spreadsheet tool you are using).
The total ROI is irrelevant and misleading - why does OP show it to me?
In fact, the annual ROI (or the internal rate of return - IRR) is perhaps the single most important number that you want to know. However, on the overview dashboard, OP gives only the total ROI. The total ROI is irrelevant because it covers different periods of time. It will be small when you started only recently and large when you have been invested for a long time. It can even appear huge but hide the fact that your stocks are underperforming.
Hiding the truth that you need only one type of investment: ETFs
Why does the bank make it so difficult for normal people to easily follow the performance of their portfolio? I have a hunch, that your bank does not even want you to know too much about your individual stocks' performances. Seeing clearly the performance of your individual stocks, you will likely realize that they are underperforming compared to the market and that you would be better off with an ETF that covers the whole world. However, that is not very profitable for your bank!
OP does not calculate the IRR for individual stocks for you - you need to do it yourself!
You should WANT to know which stocks and funds were doing well and which were underperforming. How else are going to learn? In order to compare, you need to relate the ROI to a specific time period. Typically this period is one year and this number is called the annual return on investment (ROI) or internal rate of return (IRR). OP does not give you the IRR for individual stocks! You must calculate it for yourself. The calculation is not difficult unless you have performed transactions with that specific stock during that year. This number is something I would expect from a good online banking service to calculate for the customer by default.
Short instruction on how to find the annual ROI from the OP online banking UI
You go to "Säästöt ja sijoitukset" (navigation on the top). From the leftmost menu column, you select "Arvopaperisäilytys". The name of this tab ("Storing of securities") is IMHO grossly misleading. Under this tab you find:
- Omaisuus: an overview of your investments
- Kehitys: follow the development of your investments
- Tapahtumat: list all investment-related events (purchases, sales, dividend payments, tax withholds)
- Raportit: generate/download various reports
- Perustiedot: Information about your investment account
Assets overview
The "Omaisuus" ("Assets") tab is selected by default. You see a graph that shows how your assets are divided among different investment classes (such as stocks, funds, etc.). Below that graph you see a tabular overview of the different investment classes: "Hankinta-arvo" (= acquisition value) is how much you have paid altogether for all your investments (from your very first investment that you did at OP). "Markkina-arvo" is the value of all your investments at the moment. "Muutos" ("change") is the appreciation (or depreciation if your portfolio has lost on value). None of these numbers are really useful for you, because in order to evaluate your performance, you want to know the annual ROI.

Development
In order to evaluate your portfolio's performance, you need to change to the "Kehitys" ("Development") tab. You first need to define a period ("Valitse tarkasteluvuosi"). Choose the last year (that would be as of today 2021). For some reason, there is a bug in the OP system, that prevents the graphs from loading. Under the "Kehitys" tab, there are two clickable items separated by a pipe: "Realisoituneet tuotot | Kehitys". In order to see the graphs, I needed to switch from the "Kehitys" to the "Realisoituneet tuotot" and back to "Kehitys". Only then am I able to load the graph for the development of your portfolio (as a curve) and - below - split up by month (as a bar chart). Below you see the performance of your whole portfolio ("Koko salkku"). However, this is misleading because stocks within the so-called "Osakesäästötili" (equity savings account) are NOT included.
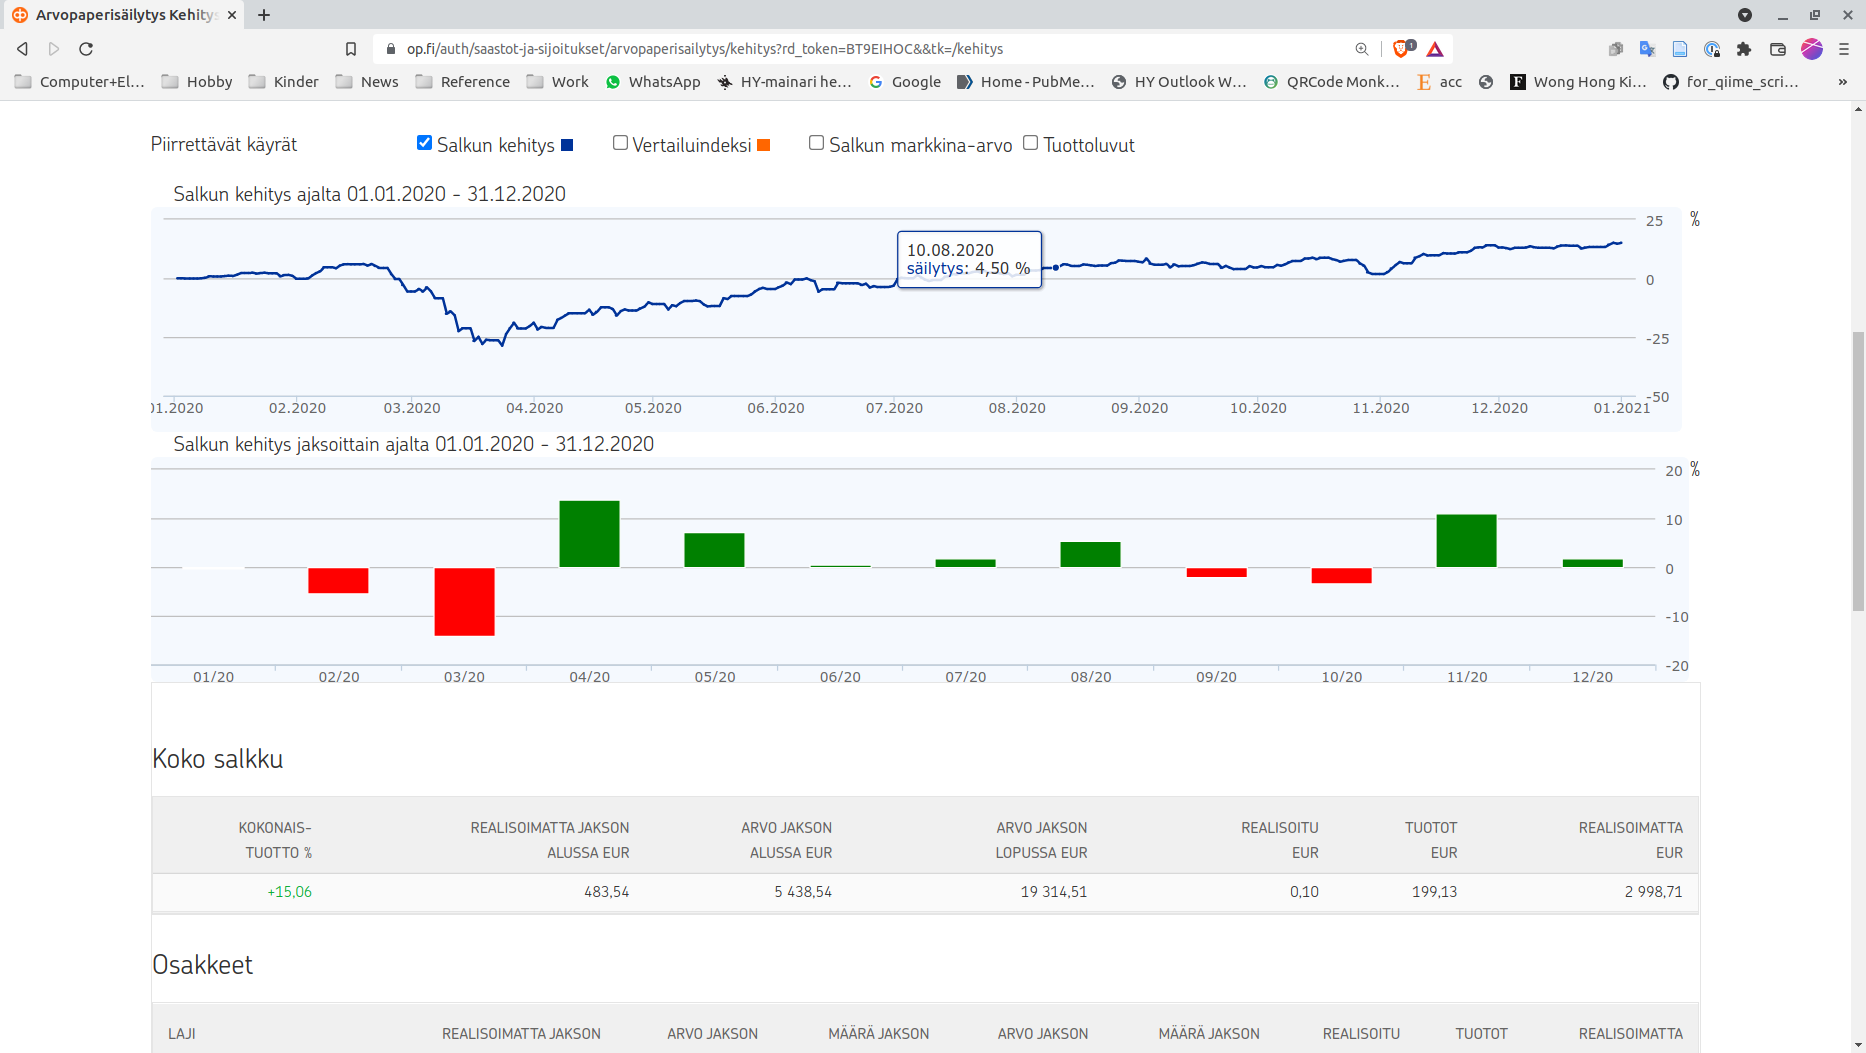
Overall performance
"Kokonaistuotto" means the "Overall productivity", i.e. how many % your investments have gained on value during the selected year. It should be pretty much the same as annual ROI or IRR. In this example (from the 1. corona year) this was 15.05%. The next two numbers describe the situation of your portfolio at the beginning of the period. The "Arvo jakson alussa") is the value of your portfolio at the beginning of the period (in this case on 1.1.2020). The "Realisoimatta jakson alussa" is the value that your portfolio has gained from the beginning of your investments until the beginning of the period. The "Arvo jakson lopussa" is the value at the end of the period, and the "Realisoimatta" is the value that your portfolio has gained from the beginning until the end of the period. If you subtract the "Realisoimatta" from the "Arvo" for both the beginning and the end of the period you get two numbers:
1. Beginning of the period: 5438.54-483.54 = 4955 (this is all you have invested before the start of the period)
2. End of the period: 19314,51-2998,71 = 16315,8 (this is all you have invested ever)
Calculation: 16315.8 - 4955 = 11360,8 (this is the total amount of money you have invested in 2020)
Calculating the IRR for individual stocks
Below this, the individual components of your portfolio are listed with the equivalent numbers. Unfortunately, OP does not show you the most important number: the IRR in % for each individual security. But you calculate it yourself from the "Arvo jakson lopussa" and "Arvo jakson alussa". E.g. for Fortum the calculation would be 2078,23×100%÷1516,9 = 137,01%. That means that Fortum shares had gained 37.01% during 2020.

Calculating the IRR for stocks with transactions during the calculation period
However, that works only smoothly when you did not buy or sell shares during the year. As you can see above, two of the shares in this example portfolio did lose in 2021 in value: The elevator producer Kone and the Olvi brewery. If you buy a new stock sometime during the year, you need to adjust the annual ROI accordingly (i.e. if you bought it at the beginning of July for the amount x and it is worth 1.1x at the end of the year, the annual ROI is actually 0.2 or 20%). The more transactions you perform, the more difficult the calculation becomes. You need to know the exact dates for each individual purchase. Luckily, both Excel and LibreOffice have functions for this type of calculation. The necessary data for these calculations you get from the "Tapahtuma" tab.
Dividends
Be aware that the above calculations do neither include the dividends nor the commissions you pay for your transactions! In order to include them, you need to add the dividends to the share price at the end of the year and subtract the commissions (if you did buy in that year). However, they typically do not change the performance by much. I just checked my portfolio and I have to admit that the ROI of my ETFs did beat my hand-picked stocks. My best performing stock in 2021 was surprisingly Nokia with +76.9% and my worst performing stock Neste with 21.6% (after adjustment for its dividends).
XIRR calculation within a spreadsheet program
Doing the same calculation for the OP funds saving plan manually is a pain in the ass. The correct Excel or LibreOffice function to use is XIRR: "Return the internal rate of return for a non-periodic schedule of payments".
You need two columns: One with a set of dates and one with a set of transactions. Two rows (typically the first and the last) are reserved for the first and the last date of the calculation period (i.e. January 1st and December 31st). In the January 1st row, you enter the value of the security at the beginning of the calculation period (as a negative value), in the December 31st row, you enter the value of the security and the end of the calculation period (as a positive value). For all other transaction dates, you fill in the transaction (for buying a negative value, for selling a positive value. Unlike in the normal IRR function, these dates can be completely arbitrary in the XIRR function. In the example below, I calculated the IRR for 2021 for a savings plan, which I had started years before, but for which I increased my monthly investments from 100€ to 150€ in June.

In 2021, my lowest performing fund was OP-AASIA INDEKSI A with a return of 9.04%. The best performing fund was OP-AMERIKKA INDEKSI A with 37.01%. Below you can see the calculation in LibreOffice. In addition to each transaction, you have to give the value of the fund at the beginning and at the end of the year (rows in red). The biggest issue is that OP does not provide any way to download these values in a standard format (such as CSV). Therefore you have to copy and paste the table from the webpage into LibreOffice or Excel and then manually fix the dates and values because they are not recognized as such.
Adjusting for inflation
All of the above calculations do not take inflation into account. If your portfolio appreciates by 10% during one year and the inflation is 5%, the real appreciation is only 5%. And if another portfolio appreciates by 5% during the same year, it means that you did not gain anything. That is still better than losing 5% of the value which happens when you simply keep your money on a savings account.
OP doesn't have an ETF savings plan
Most of my individual stocks did worse than my ETFs. In fact, I would have been better off by just having ETFs (World, North America) in my portfolio. However, OP does not even offer any saving plans for ETFs. The only saving plans they offer are for OP-managed funds, which have significantly higher annual costs than real ETFs. I would need to open an account with Nordnet or some other Fintech service provider.